Main || CV || Publications || Software || Visuals and Animations


Visuals and Animations

1. Interactive view of a huge correlation matrix.

Correlation matrix heatmap I work with large datasets a lot, and find it useful to visualize them. A good example of a large matrix is the correlation matrix of copy number measurements at 14,556 markers and expression of 14,556 genes. I used two separate tools to visualize and study such a huge matrix.

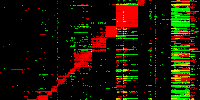
Google Maps based. First visualization of the correlation matrix is based on the Google Maps engine. It is written in Javascript and works on almost any platform.

Silverlight based. Another visualization of the correlation matrix is based on an existing silverlight application, DH view SL, originally developed for viewing large, stitched panoramic images.

2. Animated gifs.

2.a. K-means clustering. K-means++.

K-means clustering This series of 5 gif aninmations illustrates the process of k-means clustering. It clearly shows how an unlucky choice of starting points can lead to a strongly suboptimal choice of clusteers.

This multipage PDF illustrates a more efficient version of k-means clustering called k-means++. It uses weighted seeding of the starting points.

D. Arthur and S. Vassilvitskii. K-means++: The advantages of careful seeding. SODA '07 Proceedings of the eighteenth annual ACM-SIAM symposium on Discrete algorithms.

2.b. Greatest Convex Minorant

Greatest Convex Minorant This gif animation illustrates an O(n) algorithm for construction of the Greatest Convex Minorant for a given set of points (or a piece-wise linear function).

2.c. Nearest unimodal distribution.

Nearest unimodal distribution, Dip statistic This gif animation illustrates the key idea behind the algorithm for construction of the nearest unimodal distribution for a given one. The solution is the nearest unimodal distribution (minimizes Kolmogorov–Smirnov distance) to a given one.

J. A. Hartigan and P. M. Hartigan. The Dip Test of Unimodality. The Annals of Statistics Vol. 13, No. 1 (Mar., 1985), pp. 70-84

2.d. Hilbert curve.

Hilbert curve This gif animation illustrates the Hilbert curve construction for n = 7. For better performance the animation shows each 19-th frame of the original 16,384 frames of full animation.

More about Hilbert curve at wikipedia.org.

2.e. From histogram to density

From histogram to density This gif animation illustrates how sample histograms become smoother and smoother as the sample size grows. For huge sample sizes the histogram is indistinguishable from a density plot.

Main || CV || Publications || Software || Visuals and Animations